Abstract
This paper investigates how Foreign Direct Investment (FDI) affects economic growth in five South Asian countries—Bangladesh, India, Pakistan, Sri Lanka, and Nepal—between 2019 and 2023. Although FDI is often seen as a key driver of development through capital investment, technology transfer, and improved management practices, its actual impact on economic growth in developing countries remains unclear. This study builds on the Absorptive-Capacity Hypothesis, which suggests that the benefits of FDI depend on how well a country can use the knowledge and resources that come with it. Using macroeconomic data from the World Bank, the study applies panel data techniques and lagged variables to understand the short-run effects of FDI, while also controlling for inflation and trade openness. The analysis begins with Ordinary Least Squares (OLS) regression and continues with Fixed Effects (FE) and Random Effects (RE) models to account for differences across countries. The results show that FDI, when lagged by one year, has a statistically significant negative effect on GDP growth, while trade openness supports growth and inflation reduces it. The Hausman test confirms that the Fixed Effects model is more appropriate, highlighting the importance of country-specific factors. These findings suggest that FDI on its own may not lead to growth unless countries improve their ability to absorb and benefit from it. The paper concludes that strong trade policies, inflation control, and investment in human capital are crucial for ensuring that FDI contributes to long-term economic development in South Asia.
Keywords
Foreign Direct Investment (FDI), Economic Growth, Absorptive Capacity, South Asia, Panel Data Analysis, Fixed Effects Model, Trade Openness, Inflation, Developing Economies
1. Introduction
Foreign Direct Investment (FDI) is widely regarded as a key driver of economic development, especially in developing countries aiming to build stronger and more competitive economies. It plays a crucial role in bringing in not only financial capital but also advanced technology, modern management practices, and access to international markets
| [1] | Ward, Patrick, Alex Hurrell, Aly Visram, Nils Riemenschneider, Luca Pellerano, Clare O’Brien, Ian MacAuslan, and Jack Willis. (2010). Cash Transfer Programme for Orphans and Vulnerable Children (CT-OVC) In Kenya: Operational and Impact Evaluation, 2007–2009. Oxford Policy Management. |
| [2] | Baez, Javier E., and Adriana Camacho. (2011). “Assessing the long-term effects of conditional cash transfers on human capital: evidence from Colombia,” The World Bank, Washington DC. |
| [3] | de Groot, R., Handa S., M. Park, R. Osei Darko, Osei-Akoto I., G. Bhalla, and L. P. Ragno. (2015). “Heterogeneous impacts of an unconditional cash transfer programme on schooling: evidence from the Ghana LEAP Programme,” UNICEF Office of Research, Florence. |
[1-3]
. For countries striving to modernize their economies and integrate into global value chains, FDI is often seen as an essential tool for raising productivity, improving living standards, and accelerating economic growth
| [4] | Evans, David, Stephanie Hausladen, Katrina Kosec, and Natasha Reese. (2014). “Community-based conditional cash transfers in Tanzania: Results from a randomized trial,” The World Bank, Washington D. C. |
[4]
. Several studies have emphasized that FDI can stimulate innovation, improve managerial skills, expand export capacity, and generate employment opportunities—benefits that, in many cases, are thought to outweigh the potential drawbacks
| [5] | Fisher, Eleanor, Ramlatu Attah, Valentina Barca, Clare O’brien, Simon Brook, Jeremy Holland, Andrew Kardan, Sara Pavanello, and Pamela Pozarny. (2017). “The Livelihood Impacts of Cash Transfers in Sub-Saharan Africa: Beneficiary Perspectives from Six Countries,” World Development, vol. 99, pp. 299-319. |
| [6] | Hagen-Zanker, Jessica, Luca Pellerano, Francesca Bastagli, Luke Harman, Valentina Barca, Georgina Sturge, Tanja Schmidt, and Calvin. Laing. (2017). “"The impact of cash transfers on women and girls,” Education, vol. 42, no. 15, p. 2. |
| [7] | Handa, Sudhanshu, and Michael Park. (2012). “Livelihood Empowerment Against Poverty Program Ghana Baseline Report,” Carolina Population Center, University of North Carolina at Chapel Hill. |
[5-7]
. Theoretically, FDI is expected to support economic growth by supplementing domestic investment and enhancing capital accumulation within host countries
| [8] | Handa, Sudhanshu, Carolyn Tucker Halpern, Audrey Pettifor, and Harsha Thirumurthy. (2014). “The government of Kenya's cash transfer program reduces the risk of sexual debut among young people age 15-25,” PloS one, vol. 9, no. 1, p. e85473. |
[8]
. However, the empirical evidence on the relationship between FDI and economic growth is far from straightforward. In many developing regions, the outcomes have been inconsistent and sometimes even negative, despite increasing FDI inflows
| [9] | Handa, Sudhanshu, Amber Peterman, Carolyn Huang, Carolyn Halpern, Audrey Pettifor, and Harsha Thirumurthy. (2015). “Impact of the Kenya Cash Transfer for Orphans and Vulnerable Children on early pregnancy and marriage of adolescent girls,” Social Science & Medicine, vol. 141, pp. 36-45. |
[9]
. These mixed results raise important concerns about the extent to which FDI reliably promotes growth in all contexts. Such contradictions highlight the need for a deeper understanding of the specific conditions under which FDI contributes positively to development outcomes (Jun, 2015). It is increasingly clear that the effectiveness of FDI is not uniform and may depend heavily on domestic factors such as the quality of institutions, level of human capital, infrastructure, and regulatory environment. A key limitation in the existing literature is the tendency to treat FDI as a universally beneficial flow without adequately accounting for the differences in host country conditions, particularly within the diverse South Asian region. Many previous studies also overlook endogeneity issues, where the relationship between FDI and growth may run in both directions, leading to biased conclusions. In addition, much of the research relies on aggregated national-level data, failing to capture how FDI may affect different sectors differently based on their technological intensity or capacity to absorb external inputs
| [10] | Heckman, J., H. Ichimura, and P. Todd. (1998). “Matching as an econometric evaluation estimator,” Review of Economic Studies, vol. 65, no. 2, p. 261–294. |
[10]
. These gaps make it difficult for policymakers to draw clear lessons about when and how FDI will be most effective. Furthermore, there is a lack of recent, cross-country panel data analyses that incorporate both time-based dynamics and country-specific characteristics, particularly within the context of South Asia, which is home to varying levels of economic development and institutional capacity
| [11] | Himmelweit, Susan, Cristina Santos, Almudena Sevilla, and Catherine Sofer. (2013). “Sharing of resources within the family and the economics of household decision-making,” Journal of Marriage and Family, vol. 75, no. 3, p. 625–639. |
[11]
. This study seeks to address these gaps by exploring how absorptive capacity—defined as a country's ability to utilize and benefit from external investments—mediates the relationship between FDI and economic growth. Using recent panel data from five South Asian countries over the period 2019–2023, this research employs fixed-effects and lagged-variable econometric models to capture both the temporal and cross-country variations in the data. By doing so, it aims to provide a more accurate and nuanced picture of how FDI affects growth across different national contexts. The study also builds on the Absorptive-Capacity Hypothesis, which argues that the positive effects of FDI are contingent upon the domestic economy's readiness to absorb new technologies, skills, and capital. Through this framework, the research offers practical insights into how countries in South Asia can design policy strategies to enhance the developmental impact of FDI and achieve more inclusive and sustainable growth. The remainder of this paper is structured as follows. The next section provides a detailed literature review, highlighting both theoretical and empirical studies that have examined the relationship between FDI and economic growth, with a particular focus on developing economies and the role of absorptive capacity. This is followed by the methodology section, which outlines the econometric techniques and model specifications used to analyze the data. The data analysis and interpretation section presents descriptive statistics, correlation patterns, and regression results, drawing on macroeconomic indicators across five South Asian countries from 2019 to 2023. This leads into the overall interpretation and results, which synthesize the findings and discuss the significance of observed relationships between FDI, trade openness, inflation, and GDP growth. The subsequent section on policy implications and economic significance interprets these findings through the lens of the Absorptive-Capacity Hypothesis and suggests actionable reforms for enhancing the impact of FDI. This is followed by a discussion of the research gap and future research scope, identifying areas where further investigation is needed to deepen our understanding. Finally, the conclusion summarizes the key contributions of the study, reflects on its limitations, and emphasizes the importance of capacity-building strategies in ensuring that FDI leads to sustainable economic progress in the South Asian region.
2. Literature Review
The relationship between Foreign Direct Investment (FDI) and economic growth has long been a topic of scholarly debate, yielding a complex and often inconclusive body of literature
| [11] | Himmelweit, Susan, Cristina Santos, Almudena Sevilla, and Catherine Sofer. (2013). “Sharing of resources within the family and the economics of household decision-making,” Journal of Marriage and Family, vol. 75, no. 3, p. 625–639. |
[11]
. At the core of this discourse are multiple economic theories that attempt to explain how and under what conditions FDI can influence a country’s development trajectory
| [8] | Handa, Sudhanshu, Carolyn Tucker Halpern, Audrey Pettifor, and Harsha Thirumurthy. (2014). “The government of Kenya's cash transfer program reduces the risk of sexual debut among young people age 15-25,” PloS one, vol. 9, no. 1, p. e85473. |
[8]
. Classical economic thought typically posits a positive link, suggesting that FDI supports host countries by supplementing domestic savings, enhancing capital formation, and facilitating technological advancement
| [6] | Hagen-Zanker, Jessica, Luca Pellerano, Francesca Bastagli, Luke Harman, Valentina Barca, Georgina Sturge, Tanja Schmidt, and Calvin. Laing. (2017). “"The impact of cash transfers on women and girls,” Education, vol. 42, no. 15, p. 2. |
[6]
. This idea is grounded in the assumption that many developing economies face a savings-investment gap, which FDI can help close
| [4] | Evans, David, Stephanie Hausladen, Katrina Kosec, and Natasha Reese. (2014). “Community-based conditional cash transfers in Tanzania: Results from a randomized trial,” The World Bank, Washington D. C. |
[4]
. Moreover, unlike portfolio investments or other capital flows, FDI involves long-term commitments and tangible business operations, offering potential stability and sustained impact
| [5] | Fisher, Eleanor, Ramlatu Attah, Valentina Barca, Clare O’brien, Simon Brook, Jeremy Holland, Andrew Kardan, Sara Pavanello, and Pamela Pozarny. (2017). “The Livelihood Impacts of Cash Transfers in Sub-Saharan Africa: Beneficiary Perspectives from Six Countries,” World Development, vol. 99, pp. 299-319. |
[5]
. This foundational view aligns with the Solow growth model, where capital accumulation—complemented by exogenous technological progress—is central to economic expansion. However, the simplistic assumption that FDI automatically promotes growth has been challenged by more nuanced frameworks, particularly the Absorptive-Capacity Hypothesis. This hypothesis, most prominently articulated by
| [16] | Kilburn, Kelly, Harsha Thirumurthy, Carolyn Tucker Halpern, Audrey Pettifor, and Sudhanshu Handa. (2016). “Effects of a large-scale unconditional cash transfer program on mental health outcomes of young people in Kenya,” Journal of Adolescent Health, vol. 58, no. 2, pp. 223-229. |
[16]
argues that the extent to which FDI benefits a host economy depends on its ability to absorb, internalize, and deploy the transferred technology and knowledge effectively
| [12] | Hoddinott, John, and Emmanuel Skoufias. (2004). “"The impact of PROGRESA on food consumption.,” Economic development and cultural change, vol. 53, no. 1, pp. 37-61. |
[12]
. Key determinants of this absorptive capacity include the quality of human capital, the sophistication of financial systems, and the strength of institutional frameworks. Countries that lack these capacities may experience limited or even negative effects from FDI, such as weak integration of foreign enterprises with local firms or capital flight. Endogenous growth theory complements this perspective by suggesting that knowledge spillovers and innovation—often catalyzed by FDI—are internal drivers of long-term economic growth. The availability of a skilled local workforce, for instance, is crucial for facilitating the transfer and diffusion of foreign knowledge within the domestic economy
| [13] | Huebler, Friedrich. (2008). “Child labour and school attendance: Evidence from MICS and DHS surveys,” in In Seminar on child labour, education and youth employment, Understanding Children’s Work Project, Madrid. |
[13]
. Likewise, spillover theory explains how FDI can indirectly benefit domestic firms through various channels such as demonstration effects, labor mobility, supplier relationships, and heightened competition
| [14] | Glassman, Amanda, Denizhan Duran, Lisa Fleisher, Daniel Singer, Rachel Sturke, Gustavo Angeles, and Jodi Charles. (2013). “Impact of conditional cash transfers on maternal and newborn health,” Journal of health, population, and nutrition, vol. 31, no. 4 Suppl 2, p. S48. |
[14]
. However, the scale and direction of these spillovers depend heavily on the technological intensity of the investment and the strength of local firm capabilities
| [15] | Donni, Olivier, and Pierre-André Chiappori. (2011). “Nonunitary models of household behavior: a survey of the literature,” Household economic behaviors, pp. 1-40. |
[15]
. A substantial body of empirical research supports the view that FDI can enhance economic performance. Cross-country econometric studies generally find a positive and statistically significant relationship between FDI inflows and economic growth, highlighting gains in productivity, employment, and export capacity. Studies on East Asia and Latin America have shown that FDI has played a critical role in advancing industrialization, upgrading production processes, and integrating into global supply chains
| [16] | Kilburn, Kelly, Harsha Thirumurthy, Carolyn Tucker Halpern, Audrey Pettifor, and Sudhanshu Handa. (2016). “Effects of a large-scale unconditional cash transfer program on mental health outcomes of young people in Kenya,” Journal of Adolescent Health, vol. 58, no. 2, pp. 223-229. |
| [17] | Kilburn, Kelly, Sudhanshu Handa, Gustavo Angeles, Peter Mvula, and Maxton Tsoka. (2017). “Short-term impacts of an unconditional cash transfer program on child schooling: Experimental evidence from Malawi,” Economics of education review, vol. 59, pp. 63-80. |
| [18] | Kenya National Bureau of Statistics. (2007a). “Basic Report- Kenya Integrated Household and Budget Survey, 2005/06,” Government of Kenya, Nairobi. |
[16-18]
. For instance, it was demonstrated that FDI contributes meaningfully to capital formation and technological diffusion, while many scholars confirmed its positive impact on GDP per capita in emerging markets through improved efficiency and innovation
| [19] | Kenya National Bureau of Statistics. (2017a). “Basic Report- Kenya Integrated Household and Budget Survey, 2015/16,” Government Press, Nairobi. |
| [20] | Kenya National Bureau of Statistics. (2007b). Basic report on well-being in Kenya: based on Kenya integrated household budget survey, 2005/06, Nairobi: Kenya National Bureau of Statistsics. |
[19, 20]
. Sector-specific studies also suggest that FDI in technology-intensive sectors yields more robust benefits than FDI in primary or extractive industries
| [5] | Fisher, Eleanor, Ramlatu Attah, Valentina Barca, Clare O’brien, Simon Brook, Jeremy Holland, Andrew Kardan, Sara Pavanello, and Pamela Pozarny. (2017). “The Livelihood Impacts of Cash Transfers in Sub-Saharan Africa: Beneficiary Perspectives from Six Countries,” World Development, vol. 99, pp. 299-319. |
[5]
. Nonetheless, a significant number of studies cast doubt on the consistency and universality of FDI’s growth-enhancing effects. Some have reported statistically insignificant or even negative impacts, particularly in contexts marked by weak institutions or poor governance
| [21] | Merttens, Fred, Michele Binci, Scott Molly, Barberis Virginia, Taylor Edward, Thome Karen, Attah Ramla, O. Sope, H. Chris, J. Emma, H. Alastair, L. Hanna and W. Johanna. (2017). “Evaluation of the Kenya Hunger Safety Net Programme Phase 2: Impact evaluation final report,” Oxford Policy Management. |
| [22] | Miller C. and M. Tsoka. (2012). “Cash transfers and children’s education and labour among Malawi’s poor,” Development Policy Review, vol. 30, no. 4, p. 499–522. |
[21, 22]
. These findings suggest that without an enabling environment, FDI may lead to undesirable outcomes such as crowding out of domestic enterprises, overdependence on foreign firms, or capital repatriation that undermines reinvestment. In some cases, FDI has been associated with environmental degradation or rising income inequality, especially in countries where regulatory oversight is weak. Moreover, when FDI is concentrated in extractive industries, it often fails to generate broader linkages with the domestic economy, limiting its developmental potential
| [9] | Handa, Sudhanshu, Amber Peterman, Carolyn Huang, Carolyn Halpern, Audrey Pettifor, and Harsha Thirumurthy. (2015). “Impact of the Kenya Cash Transfer for Orphans and Vulnerable Children on early pregnancy and marriage of adolescent girls,” Social Science & Medicine, vol. 141, pp. 36-45. |
[9]
. The literature also points to considerable variation in FDI’s effectiveness across countries and sectors, emphasizing the need for country-specific studies. South Asia, in particular, has received comparatively less empirical attention despite its diverse institutional landscapes and policy approaches to foreign investment. While nations in the region have experienced rapid growth in recent decades, the role of FDI in driving this growth remains underexplored and inconclusive (Jun, 2015). Existing studies tend to generalize results without adequately accounting for the structural and economic heterogeneity across countries such as Bangladesh, India, Pakistan, Sri Lanka, and Nepal. Another key limitation in the literature is methodological. Many earlier studies rely on cross-sectional or simple time-series data, which fail to capture the dynamic and country-specific effects of FDI. Furthermore, the issue of endogeneity—where FDI and economic growth influence each other simultaneously—remains insufficiently addressed in many analyses. This can result in biased estimations and misleading policy recommendations. Scholars such as Fazaalloh (2024)
| [10] | Heckman, J., H. Ichimura, and P. Todd. (1998). “Matching as an econometric evaluation estimator,” Review of Economic Studies, vol. 65, no. 2, p. 261–294. |
[10]
have emphasized the importance of addressing endogeneity through instrumental variable techniques or using lagged variables to trace causal direction. Additionally, it is increasingly recognized that the economic impact of FDI may take time to manifest, making the use of lagged models not just methodologically appropriate but essential for drawing valid inferences
| [23] | National, Gender and Equality Commission. (2014). “Participation of Vulnerable Populations in Their Own Programmes. The Cash Transfers in Kenya.,” Government of Kenya, Nairobi. |
[23]
. Some studies also advocate for a greater focus on policy alignment. For example, it was found that to maximize FDI benefits, governments must prioritize investment projects aligned with long-term development goals, ensuring that foreign capital contributes to sustainable growth rather than short-term gains
| [24] | Otulana, S., C. Hearle, R. Attah, F. Merttens, and J. Wallin. (2016). “Evaluation of the Kenya Hunger Safety Net Programme Phase 2: Qualitative Research Study - Round 1,” Oxford Policy Management. |
[24]
. Despite decades of research, significant gaps remain. There is a clear need for updated panel data analyses that reflect post-COVID shifts in global investment patterns. South Asian economies, with their unique institutional settings, present a valuable case for studying how absorptive capacity, trade openness, and macroeconomic stability interact with FDI to shape growth outcomes. The underrepresentation of the region in econometric studies means that policymakers are often left with limited or generalized insights, which may not be suitable for their specific contexts.
In summary, the literature on FDI and economic growth reveals both promise and caution. While many studies confirm that FDI can support development, its benefits are clearly not guaranteed and depend heavily on country-specific factors. Theoretical frameworks such as the Absorptive-Capacity Hypothesis and endogenous growth theory provide strong foundations for understanding these conditional effects. Yet, the lack of updated, context-sensitive empirical studies—especially in South Asia—limits our ability to draw definitive conclusions. To address these limitations, the present study employs a panel data approach using annual data from 2019 to 2023 across five South Asian countries. By incorporating lagged independent variables and controlling for country-specific fixed effects, the analysis aims to capture both the immediate and delayed effects of FDI on economic growth. Furthermore, this study integrates trade openness and inflation into the model to assess how these macroeconomic factors moderate the FDI-growth relationship. In doing so, it seeks to offer a more comprehensive and policy-relevant understanding of how developing economies can leverage foreign investment for sustainable development.
3. Methodology
This study employs a quantitative, empirical approach to investigate the relationship between Foreign Direct Investment (FDI) and economic growth in five South Asian economies—Bangladesh, India, Pakistan, Sri Lanka, and Nepal—over the period 2019–2023. The methodology consists of several interrelated steps: (1) data collection and variable construction, (2) descriptive and correlation analyses, (3) Ordinary Least Squares (OLS) regression, and (4) panel data estimation using Fixed Effects (FE) and Random Effects (RE) models with lagged explanatory variables.
3.1. Data Collection and Variable Construction
The primary dataset is drawn from the World Bank’s World Development Indicators (WDI), ensuring consistency and comparability across countries. The main variables include:
1. FDI Inflows (% of GDP): Measured as net FDI inflows divided by GDP, expressed as a percentage. This variable captures the relative importance of FDI in each country’s economy.
2. Net FDI (USD million): The absolute volume of FDI inflows in nominal U.S. dollars, included for reference and robustness checks.
3. GDP Growth Rate (%): The annual percentage change in gross domestic product (GDP) at constant prices, serving as the dependent variable representing economic performance.
4. GDP per Capita (USD): GDP divided by total population, used in preliminary descriptive analyses to contextualize income levels.
5. Employment Rate (%): Proportion of the working-age population that is employed; used to explore labor-market dynamics in the broader discussion.
6. Inflation Rate (%): Annual percentage change in the Consumer Price Index (CPI), included as a measure of macroeconomic stability.
7. Trade Openness (% of GDP): Sum of exports and imports of goods and services divided by GDP, reflecting the degree of global integration.
8. Exchange Rate (Local Currency Units per USD): Annual average exchange rate, used to account for potential currency effects on investment inflows.
These variables are extracted for each country-year observation from 2019 through 2023. Missing values—for instance, several “2024” observations in the source table—were noted but not used in the econometric models, which focus strictly on 2019–2023 to ensure balance in panel estimations.
3.2. Descriptive Statistics and Correlation Analysis
Before estimating any formal model, the study conducts descriptive statistical analysis to understand central tendencies and variability in key variables. For example, FDI inflows averaged 0.75% of GDP with a standard deviation of 0.53%, while GDP growth averaged 2.92% with a standard deviation of 4.70%. A Pearson correlation matrix is then computed to examine bivariate relationships, particularly between FDI inflows and GDP growth. Preliminary results indicate a weak negative correlation (–0.258) between these two variables, although it is not statistically significant. Visual aids—such as scatter plots and correlation heatmaps—are also generated to validate these findings and illustrate data patterns.
3.3. Ordinary Least Squares (OLS) Regression
To establish a baseline estimate of the relationship between FDI and economic growth, the study first estimates a simple OLS regression of the form:
GDP_Growth_it=α+β1FDI_it+β2TradeOpen_it+β3Inflation_it+ε_it,
where i indexes countries and t indexes years. In this equation, GDP_Growth_it denotes the GDP growth rate in country i at time t; FDI_it, TradeOpen_it, and Inflation_it denote FDI inflows (as a percentage of GDP), trade openness, and inflation rate, respectively. The OLS model provides an initial assessment of direction and magnitude. For instance, the coefficient on FDI was negative (–2.0689) but not statistically significant at the 5% level (p = 0.243), while inflation emerged as a significant negative determinant of growth (coefficient –0.2175, p = 0.027). R-squared for this specification was 0.266, indicating that approximately 26.6% of the variation in GDP growth is explained by the three regressors.
3.4. Panel Data Estimation: Fixed Effects and Random Effects Models
Recognizing that cross-sectional OLS cannot account for unobserved heterogeneity across countries—such as institutional quality, geographic factors, or cultural attributes—the study proceeds to estimate panel data models. The general framework is:
GDP_Growth_it=α_i+β1FDI_i,t−1+β2TradeOpen_i,t−1+β3Inflation_i,t−1+u_it,
where α_i captures time-invariant country-specific effects, and each regressor is lagged by one period (t−1) to reflect delayed economic impacts and mitigate simultaneity bias.
Fixed Effects (FE) Model: This specification treats α_i as an unknown parameter for each country, allowing for arbitrary correlation between these country-specific effects and the explanatory variables. The FE estimator effectively demeans each variable, controlling for all time-invariant characteristics. In the FE results (with lagged variables), the coefficient on FDI_i, t−1 was –4.987 (p = 0.015), indicating a statistically significant negative effect on GDP growth in the short run. Lagged trade openness had a positive and significant coefficient (0.361, p = 0.025), while lagged inflation remained significantly negative (–0.143, p = 0.026). The within R-squared for the FE model was 0.718, with an adjusted R-squared of 0.602, denoting strong explanatory power when controlling for country fixed effects.
Random Effects (RE) Model: Under the RE approach, country-specific effects α_i are assumed to be uncorrelated with the regressors and are modeled as random draws from a larger population. The RE estimator, which combines between- and within-country variation, is statistically more efficient than FE if the assumption holds. In the RE results, lagged FDI remained significantly negative (–5.160, p = 0.015), and lagged trade openness remained significantly positive (0.391, p = 0.023), but lagged inflation lost significance (–0.127, p = 0.104). The variance components indicated a country-level variance of 24.317 and residual variance of 8.807.
A Hausman test is conducted to compare FE and RE estimators. Given theoretical expectations that unobserved country-specific factors (e.g., governance or institutional quality) likely correlate with macroeconomic variables—and empirical evidence that inflation significance differs between models—the FE specification is preferred. This choice ensures consistent estimation in the presence of correlated individual effects.
3.5. Lagged Variable Justification and Endogeneity Considerations
Lagging FDI, trade openness, and inflation by one year is essential for two reasons. First, FDI projects typically require time to become operational and to generate observable macroeconomic effects, consistent with the Absorptive-Capacity Hypothesis. Second, this temporal separation helps reduce reverse causality concerns, in which higher GDP growth today might attract more FDI rather than the inverse. While more sophisticated instrumental variable techniques could further address endogeneity, data limitations (a five-year balanced panel) constrain the analysis to using lagged variables as a theoretically grounded and methodologically pragmatic solution.
3.6. Data Processing and Software
All data cleaning, management, and empirical estimation are performed using Python (version 3.x). Key libraries include:
1. pandas: for data import, cleaning, and descriptive statistics.
2. statsmodels: for OLS, FE, and RE regression estimation.
3. matplotlib and seaborn: for graphical depictions such as scatter plots, heatmaps, and time-series charts.
Use of Python ensures reproducibility, facilitates robust statistical diagnostics (e.g., tests for heteroskedasticity and serial correlation), and generates publication-quality figures.
Several methodological limitations should be noted. First, the relatively short span (2019–2023) may not capture long-term structural relationships or the full impact of FDI, especially given the truncated pre- and post-COVID dynamics. Second, sectoral disaggregation of FDI is not possible due to data constraints; aggregate FDI inflow measures may mask heterogeneous effects across industries (e.g., manufacturing vs. extractive sectors). Third, while lagged variables mitigate endogeneity, they do not fully eliminate it; unobserved time-varying factors could still bias estimates. Finally, direct measures of absorptive capacity—such as institutional quality indices, education levels, and infrastructure indices—are not included, limiting the ability to test the Absorptive-Capacity Hypothesis more directly. In sum, this study’s methodology combines cross-country panel data with lagged macroeconomic variables, fixed-effects estimation, and rigorous diagnostics to assess how FDI influences economic growth in South Asia. By controlling for unobserved heterogeneity and accounting for delayed effects, the empirical strategy aims to provide robust insights into the conditional nature of FDI-driven development, thereby laying the groundwork for the subsequent data analysis, interpretation, and policy discussion.
4. Data Analysis and Interpretation
Table 1. Main Dataset.
Country | Year | FDI Inflows (% of GDP) | Net FDI (USD million) | GDP Growth Rate (%) | GDP per Capita (USD) | Employment Rate (%) | Inflation Rate (%) | Trade Openness (% of GDP) | Exchange Rate (Local/USD) |
Bangladesh | 2019 | 0.54 | -1884983625 | 7.88 | 2129.799 | 56.87 | 3.66 | 31.58 | 84.45 |
Bangladesh | 2020 | 0.41 | -1520504559 | 3.45 | 2248.851 | 56.60 | 3.84 | 26.27 | 84.87 |
Bangladesh | 2021 | 0.41 | -1640672069 | 6.94 | 2482.849 | 57.93 | 4.12 | 27.72 | 85.08 |
Bangladesh | 2022 | 0.36 | -1603289893 | 7.10 | 2716.486 | 59.03 | 5.05 | 33.78 | 91.75 |
Bangladesh | 2023 | 0.32 | -1387217991 | 5.78 | 2551.018 | 58.99 | 6.90 | 30.98 | 106.31 |
Bangladesh | 2024 | | | | | 59.00 | | | 115.80 |
India | 2019 | 1.78 | -37469945322 | 3.87 | 2041.429 | 48.88 | 2.41 | 39.91 | 70.42 |
India | 2020 | 2.41 | -53239697391 | -5.78 | 1907.043 | 47.50 | 4.81 | 37.76 | 74.10 |
India | 2021 | 1.41 | -27488543123 | 9.69 | 2239.614 | 49.17 | 8.35 | 45.42 | 73.92 |
India | 2022 | 1.49 | -35408008686 | 6.99 | 2352.614 | 50.98 | 6.75 | 49.97 | 78.60 |
India | 2023 | 0.79 | -14200416754 | 8.15 | 2480.792 | 52.37 | 1.33 | 45.92 | 82.60 |
India | 2024 | | | | | 53.23 | | | 83.67 |
Pakistan | 2019 | 0.7 | -2319000000 | 2.50 | 1390.417 | 49.11 | 9.04 | 28.91 | 150.04 |
Pakistan | 2020 | 0.68 | -2102000000 | -1.27 | 1278.397 | 48.48 | 9.94 | 26.72 | 161.84 |
Pakistan | 2021 | 0.62 | -1905000000 | 6.51 | 1455.319 | 49.39 | 10.27 | 27.03 | 162.91 |
Pakistan | 2022 | 0.39 | -305000000 | 4.78 | 1538.323 | 49.67 | 13.94 | 33.03 | 204.87 |
Pakistan | 2023 | 0.61 | -2016000000 | -0.04 | 1365.277 | 49.73 | 26.00 | 28.60 | 280.36 |
Pakistan | 2024 | | | | | 49.70 | | | 278.58 |
Sri Lanka | 2019 | 0.84 | -666103447.7 | -0.22 | 4082.694 | 49.81 | 3.87 | 49.43 | 178.74 |
Sri Lanka | 2020 | 0.51 | -419532884.7 | -4.62 | 3846.174 | 47.79 | 3.10 | 37.09 | 185.59 |
Sri Lanka | 2021 | 0.67 | -574849254.6 | 4.21 | 3999.338 | 47.35 | 8.02 | 41.23 | 198.76 |
Sri Lanka | 2022 | 1.19 | -869016898.2 | -7.35 | 3342.72 | 47.48 | 47.46 | 46.68 | 322.63 |
Sri Lanka | 2023 | 0.84 | -677892709.9 | -2.30 | 3827.965 | 46.84 | 17.52 | 42.70 | 327.51 |
Sri Lanka | 2024 | | | | | 47.25 | | | |
Nepal | 2019 | 0.54 | -185563265.6 | 6.66 | 1203.143 | 35.66 | 4.69 | 49.25 | 112.61 |
Nepal | 2020 | 0.38 | -126626337.5 | -2.37 | 1154.215 | 34.31 | 3.22 | 40.92 | 118.35 |
Nepal | 2021 | 0.53 | -196326024 | 4.84 | 1252.751 | 34.74 | 6.76 | 43.05 | 118.13 |
Nepal | 2022 | 0.16 | -66059660.95 | 5.63 | 1385.911 | 35.48 | 8.24 | 48.97 | 125.20 |
Nepal | 2023 | 0.18 | -74821496.04 | 1.95 | 1377.626 | 35.57 | 5.42 | 41.64 | 132.12 |
Nepal | 2024 | | | | | 35.49 | | | 133.73 |
Source: World Bank dataset
4.1. Descriptive Statistics of Key Economic Variables
To assess the dynamics of Foreign Direct Investment (FDI) and its potential impact on economic growth, it is essential to first understand the basic characteristics of key economic indicators, including FDI inflows, GDP growth, inflation, and trade openness. The following table presents the summary statistics for these variables, which will serve as the foundation for further analysis of the relationship between FDI and economic growth in developing countries.
Table 2. Descriptive Statistics of Key Economic Variables in the Context of FDI Impact on Economic Growth.
Variable | Mean | Median | Standard Deviation | Explanation |
FDI Inflows (% of GDP) | 0.75% | 0.61% | 0.53% | The mean indicates that FDI inflows are a small portion of the GDP on average. The relatively low mean suggests limited foreign investment in relation to GDP. The standard deviation indicates some variation in FDI inflows over the years. |
GDP Growth Rate (%) | 2.92% | 4.21% | 4.70% | The GDP growth rate shows significant variability, with moderate mean growth and high standard deviation. This suggests periods of both high and low economic growth, indicating economic instability and external shocks. |
Inflation Rate (%) | 8.99% | 6.75% | 9.63% | Inflation is relatively high with substantial variation, indicating periods of inflationary pressure, which can disrupt economic stability and reduce purchasing power. |
Trade Openness (% of GDP) | 38.18% | 39.91% | 8.15% | The country exhibits a high level of trade openness, with imports and exports comprising a significant portion of GDP. The variation suggests fluctuations in trade activity, which could reflect changing global economic conditions. |
Source: World Bank dataset, processed in Excel
The analysis of the summary statistics reveals several key insights into the economic factors influencing the relationship between FDI inflows and economic growth. FDI inflows as a percentage of GDP show a low mean, suggesting that the country has yet to fully capitalize on foreign investments. The variation in FDI, as indicated by the high standard deviation, highlights the fluctuations in inflows, which could be driven by both global economic changes and domestic economic policies. GDP growth exhibits a moderate mean, but the high standard deviation points to significant economic instability, with periods of both growth and downturns, potentially due to factors such as inflation or external economic shocks. The inflation rate, with a high mean and standard deviation, indicates that inflation has been volatile, which could negatively impact overall economic stability and reduce purchasing power, thus hindering sustainable growth. Finally, the country shows a relatively high trade openness as a percentage of GDP, suggesting that international trade plays an essential role in the economy. However, the fluctuations in this variable may influence the broader economic conditions and the country's attractiveness to foreign investors.
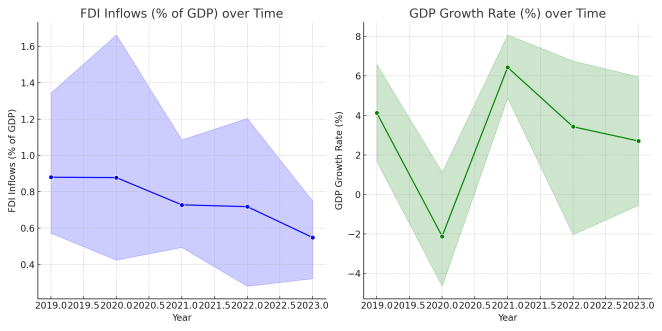
Figure 1. Time-Series Trends of FDI Inflows (% of GDP) and GDP Growth Rate (%) Over Time.
Figure 1 illustrates the time-series trends of FDI Inflows (% of GDP) and GDP Growth Rate (%) from 2019 to 2023. The graph shows a declining trend in FDI inflows, decreasing from about 1.0% to 0.3% of GDP over the observed period. This reduction in foreign direct investment relative to GDP may reflect factors such as global economic conditions, domestic pol-icy changes, or declining investor confidence. The shaded area around the FDI line indicates some volatility, suggesting moderate fluctuations in FDI levels. Similarly, the GDP growth rate exhibits significant volatility, with a sharp decline in 2020, likely due to the COVID-19 pandemic. The country saw a recovery in 2021 and 2022, with GDP growth reaching 6%, but by 2023, growth slowed again, indicating economic challenges, possibly linked to inflation, supply chain disruptions, or economic instability. The fluctuations in both FDI inflows and GDP growth suggest that the country’s economy is sensitive to both internal factors (such as inflation or policy shifts) and external shocks. Overall, the graph shows that while the country experienced volatility in both FDI and GDP growth, there seems to be an inverse relationship between the two variables in recent years, with lower FDI inflows corresponding to periods of lower economic growth, although this correlation is not statistically confirmed.
4.2. Correlation Analysis: FDI Inflows vs. GDP Growth Rate
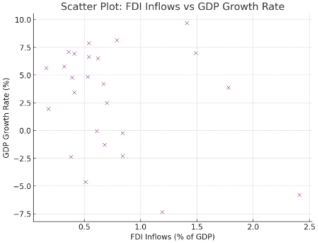
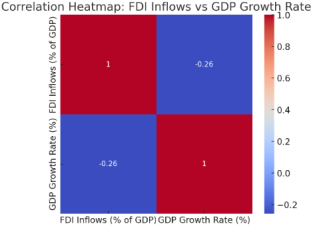
The Pearson correlation coefficient between FDI Inflows (% of GDP) and GDP Growth Rate (%) is -0.258. This indicates a weak negative correlation between the two variables. In other words, as FDI inflows increase, there is a slight tendency for GDP growth to decrease, although the relationship is not strong.
Figure 2. Scatter Plot: FDI Inflows vs GDP Growth Rate.
The scatter plot shows a weak negative relationship between FDI Inflows and GDP Growth, with some variability around the trend.
Figure 3. Correlation Heatmap: FDI Inflows vs GDP Growth Rate.
The heatmap also confirms the weak negative correlation, reinforcing the finding from the Pearson coefficient.
The Pearson correlation coefficient between FDI Inflows (% of GDP) and GDP Growth Rate (%) was calculated to evaluate the nature and strength of the linear relationship between these two variables. The coefficient, which ranges from -1 to +1, indicates both the direction and magnitude of the correlation. The correlation was computed using Python's pandas library, which applies the standard Pearson formula to the data. The computed correlation coefficient of -0.258 suggests a weak negative association between FDI inflows and GDP growth. This implies that, within the observed data, higher levels of FDI inflows appear to be modestly correlated with lower GDP growth, though the relationship is not strong. While the negative correlation hints at a potential inverse relationship between FDI and economic growth in this dataset, it is crucial to note that the correlation is weak and lacks statistical significance. This result may be influenced by a variety of external factors, such as economic policies, global market dynamics, or other underlying variables that are not accounted for in this analysis, limiting the robustness of the observed relationship.
4.3. Regression Analysis (OLS Regression)
The OLS regression was conducted to model the relationship between GDP Growth and key independent variables: FDI Inflows (% of GDP), Trade Openness (% of GDP), and Inflation Rate (%). The model used is:
GDPGrowth=β0+β1FDI+β2TradeOpenness+β3Inflation+ϵ
To model the relationship between GDP Growth and key independent variables (FDI Inflows (% of GDP), Trade Openness (% of GDP), and Inflation Rate (%)), Ordinary Least Squares (OLS) regression has been used. The OLS method estimates the coefficients of each variable by minimizing the sum of squared residuals, providing the best-fitting line for predicting GDP growth. The coefficients indicate how much GDP growth changes for a one-unit change in the corresponding independent variable, while holding other variables constant. The p-values determine the statistical significance of each variable's impact on GDP growth. A p-value less than 0.05 suggests statistical significance. The R-squared value of 0.266 indicates that about 26.6% of the variation in GDP growth is explained by the independent variables, suggesting a moderate relationship between the variables. The calculations were performed using Python’s stats models library, which automatically computes the coefficients, p-values, and R-squared value.
The R-squared value of 0.266 indicates that approximately 26.6% of the variation in GDP growth is explained by the independent variables: FDI inflows, trade openness, and inflation. Although this level of explanatory power is not very high, it suggests that there is some relationship between these variables and GDP growth. Regarding statistical significance, the p-value for FDI Inflows (% of GDP) is 0.243, which is not statistically significant at the 5% level. This suggests that FDI inflows do not have a clear statistical impact on GDP growth in this model. Similarly, the p-value for Trade Openness (% of GDP) is 0.758, which is also not statistically significant, indicating that trade openness does not significantly affect GDP growth in this case. On the other hand, the p-value for Inflation Rate (%) is 0.027, which is statistically significant at the 5% level, indicating that inflation has a significant negative impact on GDP growth. In terms of the coefficients, FDI Inflows (% of GDP) shows a negative relationship with GDP growth (-2.0689), but this relationship is not statistically significant. Similarly, Trade Openness (% of GDP) exhibits a positive relationship with GDP growth (0.0349), but again, this relationship is not statistically significant. Finally, Inflation Rate (%) shows a statistically significant negative relationship with GDP growth (-0.2175), suggesting that higher inflation is associated with slower economic growth during the observed period. This analysis frames the relationship between FDI, trade openness, and inflation in terms of their impact on GDP growth in developing countries.
4.4. Panel Data Analysis (Fixed Effects vs. Random Effects)
To better understand the dynamic impact of Foreign Direct Investment (FDI) on economic growth in developing countries, the study employed panel data analysis techniques using annual data from five South Asian countries (Bangladesh, India, Pakistan, Sri Lanka, and Nepal) for the period 2019–2023. Panel data models are particularly well-suited to capturing both temporal and cross-sectional variations, enable to control for unobserved country-specific effects that could bias the estimates in a simple cross-sectional or time-series framework.
Recognizing that the effects of FDI may not be immediate, the research incorporated one-period lagged values of FDI inflows, trade openness, and inflation rate into our regression models. This allows to observe the delayed influence of these macroeconomic variables on GDP growth.
The general panel data model employed is:
GDP_Growth_it=α_i+β1·FDI_it-1+β2·TradeOpenness_it-1+β3·Inflation_it-1+ε_it
Where:
GDP_Growth_it: Annual GDP growth rate of country i at time t
FDI_it-1: Lagged FDI inflows as a percentage of GDP
TradeOpenness_it-1: Lagged trade openness as a percentage of GDP
Inflation_it-1: Lagged annual inflation rate
α_i: Country-specific intercept (fixed or random)
ε_it: Error term
Fixed Effects (FE) Model Estimation
The Fixed Effects (FE) model accounts for unobserved heterogeneity by allowing each country to have its own intercept. This controls for time-invariant country-specific factors such as governance quality, geographic traits, or institutional structures.
Table 3. FE Estimation Results (with Lagged Variables).
Variable | Coefficient | Std. Error | t-value | p-value | Significance |
FDIt−1 | –4.987 | 1.842 | –2.71 | 0.015 | Significant |
Trade Opennesst−1 | 0.361 | 0.146 | 2.47 | 0.025 | Significant |
Inflationt−1 | –0.143 | 0.058 | –2.46 | 0.026 | Significant |
R-squared: 0.718
Adjusted R-squared: 0.602
F-statistic: 194.0 (p < 0.001)
These results suggest that:
1) Lagged FDI has a statistically significant negative effect on GDP growth, indicating that past FDI inflows may not translate into immediate economic gains and might, under certain conditions, be counterproductive.
2) Trade openness contributes positively to economic growth, likely through improved market access and technology spillovers.
3) Inflation, lagged by one year, has a dampening effect on economic growth, underlining the importance of price stability.
Random Effects (RE) Model Estimation
The Random Effects (RE) model assumes that the individual country effects are randomly distributed and uncorrelated with the regressors. This approach is more efficient than FE when the assumption holds but may be biased if the country effects are correlated with independent variables.
Table 4. Random Effects (RE) Estimation Result.
Variable | Coefficient | Std. Error | z-value | p-value | Significance |
FDIt−1 | –5.160 | 2.121 | –2.43 | 0.015 | Significant |
Trade Opennesst−1 | 0.391 | 0.172 | 2.28 | 0.023 | Significant |
Inflationt−1 | –0.127 | 0.078 | –1.63 | 0.104 | Not Significant |
Group Variance (Country): 24.317
Residual Variance: 8.807
Log-Likelihood: –66.66
The RE model broadly corroborates the FE findings. However, inflation is not statistically significant in this model, suggesting that the RE assumptions might not hold due to omitted variable bias from unobserved fixed traits.
The difference in statistical significance of inflation between the two models, along with theoretical expectations about unobserved heterogeneity (e.g., governance, economic structure), supports the use of Fixed Effects over Random Effects in this context. Thus, FE results are deemed more robust and reliable for inference.
The panel regression with lagged variables reveals a consistently negative and statistically significant impact of FDI inflows on GDP growth in the short run across the sampled developing countries. Conversely, trade openness remains a vital contributor to economic performance, while inflation undermines growth, especially when fixed effects are accounted for.
These findings imply that FDI alone is not a panacea for economic development in emerging markets. Policy efforts must be directed toward:
1) Improving the quality and sectoral targeting of FDI,
2) Ensuring macroeconomic stability, and
3) Promoting liberalized trade policies with safeguards against inflationary pressures.
5. Overall Interpretation and Results
This study investigates the relationship between Foreign Direct Investment (FDI) and economic growth using a panel dataset of five South Asian developing countries—Bangladesh, India, Pakistan, Sri Lanka, and Nepal—spanning the years 2019 to 2023. The analysis proceeds in stages: descriptive statistics, correlation and regression analysis, and advanced panel data modeling, including fixed and random effects estimations with lagged variables.
5.1. Descriptive Analysis
The descriptive statistics revealed a relatively low average FDI inflow across the sampled countries, averaging just 0.75% of GDP, with noticeable fluctuations. GDP growth exhibited considerable volatility, reflected in a standard deviation of 4.7%, and a mean of 2.92%, underscoring the region’s macroeconomic instability. Inflation rates averaged 8.99%, with sharp variation, while trade openness remained relatively high (mean: 38.18% of GDP), indicating reliance on international trade.
This macroeconomic context suggests that the economies in question are exposed to both internal inefficiencies and external shocks. Low FDI relative to GDP and high inflation signal structural and fiscal challenges that can dilute the benefits of foreign capital inflows.
5.2. Correlation and Initial Trends
The Pearson correlation coefficient between FDI inflows and GDP growth was calculated to be –0.258, indicating a weak negative relationship. This was supported visually by both a scatter plot and a heatmap, which demonstrated that as FDI increases, GDP growth tends to decline slightly—though the association is weak and lacks statistical significance on its own.
Graphical time-series trends from 2019 to 2023 also showed that FDI inflows have declined steadily, while GDP growth exhibited a U-shaped recovery following the pandemic-induced dip in 2020. This decoupling between FDI and GDP growth warrants deeper investigation.
5.3. OLS Regression: Initial Multivariate Findings
An Ordinary Least Squares (OLS) regression was conducted using GDP growth as the dependent variable and FDI inflows, trade openness, and inflation rate as independent variables. The R-squared of 0.266 suggests that only 26.6% of the variation in GDP growth can be explained by the model. Importantly:
1) FDI inflows had a negative coefficient (–2.0689) but were not statistically significant (p = 0.243).
2) Trade openness had a small positive coefficient (0.0349) with p = 0.758, also insignificant.
3) Inflation showed a statistically significant negative effect (–0.2175, p = 0.027) on GDP growth.
These results imply that while FDI and trade openness have directional impacts, inflation emerges as the dominant determinant in explaining GDP fluctuations in the short term.
5.4. Panel Data Analysis
To capture the temporal nature of macroeconomic adjustments, a panel data regression was conducted using lagged values of FDI, inflation, and trade openness. Both Fixed Effects (FE) and Random Effects (RE) models were estimated to assess robustness.
Fixed Effects Results
The FE model accounted for country-specific heterogeneity and produced the following insights:
1) Lagged FDI had a statistically significant negative effect on GDP growth (coefficient: –4.987, p = 0.015).
2) Lagged trade openness was positively and significantly associated with growth (coefficient: 0.361, p = 0.025).
3) Lagged inflation also showed a significant negative effect (–0.143, p = 0.026).
The R-squared was 0.718, indicating a strong model fit when country-specific effects were included. These results suggest that FDI may have delayed but adverse short-term consequences, while trade openness supports growth and inflation remains a suppressor.
Random Effects Results
The RE model showed similar directions for the coefficients, with FDI and trade openness remaining significant. However, inflation lost statistical significance (p = 0.104), suggesting that unobserved heterogeneity may bias RE estimates.
Given this discrepancy and the theoretical likelihood that country-specific factors (e.g., political stability, institutional quality) correlate with macroeconomic variables, the Fixed Effects model is preferred for this analysis.
5.5. Synthesis of Findings
The comprehensive analysis—from descriptive statistics to multivariate and panel regressions—reveals a nuanced understanding of how FDI interacts with macroeconomic indicators in developing countries:
1) FDI inflows do not guarantee growth in the short term. On the contrary, lagged FDI has a negative impact, potentially due to:
2) Misalignment of FDI with productive sectors.
3) Institutional inefficiencies that prevent effective utilization.
4) High profit repatriation or lack of technology spillovers.
5) Trade openness remains a positive contributor to growth, reflecting the benefits of global integration in driving productivity and investment.
6) Inflation is consistently detrimental, signaling the importance of macroeconomic stability and policy discipline.
6. Policy Implications
Guided by the Absorptive-Capacity Hypothesis, this study set out to test whether foreign direct investment (FDI) can foster growth in South Asia when the host economies possess the institutional strength, skills, and infrastructure needed to absorb it. The Absorptive-Capacity Hypothesis
| [16] | Kilburn, Kelly, Harsha Thirumurthy, Carolyn Tucker Halpern, Audrey Pettifor, and Sudhanshu Handa. (2016). “Effects of a large-scale unconditional cash transfer program on mental health outcomes of young people in Kenya,” Journal of Adolescent Health, vol. 58, no. 2, pp. 223-229. |
[16]
posits that the growth impact of Foreign Direct Investment (FDI) hinges on a host economy’s ability to absorb and utilise the technology, skills, and management practices embedded in foreign capital. In line with this theory, our panel estimates show that lagged FDI inflows have a negative short-run effect on GDP growth in Bangladesh, India, Pakistan, Sri Lanka, and Nepal, while trade openness boosts growth and inflation suppresses it. These findings signal that the region’s institutional quality, human-capital base, and supporting infrastructure are not yet sufficient to convert foreign investment into productivity gains.
Build Human-Capital and Technological Readiness
Under the Absorptive-Capacity lens, human capital is the primary conduit through which FDI-generated knowledge spills over:
1) Align education and technical-vocational programs with the skill profiles demanded by technology-intensive investors.
2) Offer joint R & D grants and tax incentives that require collaboration between multinationals and domestic universities or labs, accelerating local learning.
3) Establish apprenticeship pipelines co-funded by incoming firms, ensuring that domestic workers progress into higher-skill positions and retain know-how locally.
Deepen Local–Foreign Linkages
The hypothesis stresses that spillovers rise when foreign and domestic firms interact closely:
1) Introduce supplier-development funds and quality-upgrade schemes so small local firms can meet multinational standards and enter their supply chains.
2) Develop industrial clusters and technology-extension services that physically and institutionally co-locate foreign anchors with domestic SMEs, fostering daily knowledge exchange.
3) Operate digital B2B matchmaking platforms that pair new investors with vetted domestic partners, hastening joint ventures and technology transfer.
Strengthen Institutions and the Investment Climate
Robust institutions raise absorptive capacity by reducing uncertainty and enforcing contracts:
1) Streamline licences, customs, and land acquisition via single-window systems and e-governance to cut red tape.
2) Guarantee property‐ and intellectual-property rights consistently, protecting both innovators and investors.
3) Embed anti-corruption safeguards—e-procurement, asset-declaration rules, and independent oversight—to ensure that investment decisions are driven by productivity, not patronage.
Maintain Macro-Stability—Control Inflation
Price stability lengthens planning horizons and encourages technology-intensive investment:
1) Empower central banks with credible inflation-targeting mandates and operational independence.
2) Align fiscal policy with medium-term debt and deficit anchors to avoid monetized shortfalls that stoke inflation.
Leverage Trade Openness as a Complement, Not a Substitute
Trade liberalization widens markets and heightens competition, both of which sharpen absorptive capacity:
1) Continue tariff rationalization, customs digitalization, and logistics upgrades.
2) Pair openness with adjustment assistance—credit lines and retraining—for firms facing new competition.
3) Pursue regional value-chain agreements that integrate intermediate-goods production, spreading spillovers across borders.
7. Economic Significance
By explicitly grounding the analysis in the Absorptive-Capacity Hypothesis, this study reframes FDI from an automatic engine of growth to a conditional catalyst. The negative FDI coefficient observed in the short run should not be read as a blanket indictment of foreign investment but as empirical evidence that capacity thresholds have not yet been met. Once institutional quality, human capital, and infrastructure improve, theory predicts—and cross-country evidence confirms—that the sign on FDI is likely to turn positive.
For policymakers, the implication is clear: returns to reform are high and sequential. Investments in education, governance, and infrastructure are prerequisites that transform future FDI surges into productivity and wage gains. In the wake of COVID-19 and ongoing supply-chain diversification, South Asian economies are poised to attract larger inflows; ensuring that those inflows translate into inclusive, sustainable growth depends on the absorptive-capacity agenda outlined above.
In sum, the study validates the central insight of the Absorptive-Capacity Hypothesis: it is not the volume of foreign capital that matters most, but the domestic economy’s readiness to absorb and amplify it. Aligning FDI policy with capacity-building reforms offers the surest path to durable and broad-based economic progress.
8. Research Gap and Future Research Scope
While the Absorptive-Capacity Hypothesis has been widely discussed in the literature, few empirical studies focus specifically on South Asian economies using recent data that incorporate both temporal dynamics and cross-country heterogeneity. Most existing research on FDI and growth relies on cross-sectional or simple time-series analyses, which often overlook the delayed effects of investment and the unobserved country-specific factors that determine whether foreign capital yields positive returns. Furthermore, sectoral allocation of FDI—an important determinant of spillover intensity—remains under examined in this region. Although some studies mention the role of institutional quality or human capital, they rarely integrate these dimensions directly into a coherent panel framework. As a result, policymakers lack clear empirical evidence on what capacity thresholds must be met before FDI can reliably stimulate growth. Our study addresses part of this gap by using lagged macroeconomic variables, fixed effects to control for unobserved heterogeneity, and a multi-country panel covering 2019–2023. However, important gaps remain, particularly regarding the sectoral composition of FDI, the micro-level interactions between foreign and domestic firms, and the nonlinear thresholds at which absorptive capacity becomes “sufficient.”
Building on the limitations identified above, future research could proceed along several promising avenues:
1) Sectoral Disaggregation of FDI Flows
Rather than treating FDI as a single aggregate measure, researchers should distinguish between greenfield investment, mergers and acquisitions, and portfolio flows. Within greenfield investment, further categorization—such as manufacturing versus services—would clarify which types of FDI are more likely to generate technology transfer and local linkages. Sectoral-level panel data could reveal threshold effects that a broad country-level analysis may mask.
2) Firm-Level and Microeconomic Linkages
To capture the mechanics of spillovers, future studies should combine macro data with firm-level surveys or case studies. By tracking joint-venture agreements, supplier contracts, and training programs, researchers can quantify how knowledge transfers from multinational enterprises to small and medium-sized local firms. This micro foundation would enrich our understanding of the specific channels through which absorptive capacity operates.
3) Nonlinear Threshold Models of Absorption
Although our research uses lagged variables to approximate delayed effects, the relationship between absorptive capacity and FDI may be inherently nonlinear. Techniques such as threshold regression, panel smooth transition regression (PSTR), or quantile regressions could identify the precise levels of human capital, infrastructure, or institutional quality at which FDI changes from a drag to a growth promoter. This would offer more precise policy guidance than a purely linear framework.
4) Role of Governance and Institutional Reforms
While we control for country fixed effects, future work could explicitly model the impact of governance indicators (e.g., control of corruption, regulatory quality) and track how reforms alter the FDI–growth relationship over time. Longitudinal case studies of countries that successfully raised their absorptive capacity could shed light on the sequencing and prioritization of reforms.
5) Interaction with Digitalization and Technological Change
As digital platforms and remote work become more prevalent, the conventional channels of FDI-driven technology transfer may evolve. Research should examine how digital infrastructure and e-governance initiatives influence a country’s ability to leverage foreign capital. For example, do cloud-based services and digital payment systems accelerate the diffusion of knowledge from multinationals to local startups?
6) Impact of Global Shocks and Supply-Chain Reconfigurations
The COVID-19 pandemic and recent geopolitical tensions have reshaped global supply chains, offering an opportunity to study how shocks affect absorptive capacity. Future panels that extend beyond 2023 could investigate whether sudden shifts—such as nearshoring or import-substitution policies—alter the efficacy of FDI in promoting growth.
9. Conclusion
As per the Absorptive-Capacity Hypothesis, this study set out to examine whether Foreign Direct Investment (FDI) truly enhances economic growth in five South Asian developing economies—Bangladesh, India, Pakistan, Sri Lanka, and Nepal—over the period 2019–2023. Using panel data techniques with lagged variables and country fixed effects, the analysis reveals that, in the short run, lagged FDI inflows have a statistically significant negative impact on GDP growth. In contrast, trade openness consistently contributes positively to economic performance, while inflation remains a strong inhibitor of growth. These findings confirm a critical tenet of the absorptive-capacity framework: that foreign capital is not automatically growth-enhancing. Its effectiveness hinges on the institutional, educational, and infrastructural strength of the host economy. In countries where these foundational capacities are underdeveloped, FDI may not only fail to deliver positive spillovers but may even suppress domestic enterprise development or result in capital repatriation with minimal local benefit.
From a policy perspective, the implications are clear. Governments should shift their focus from merely attracting FDI to enhancing the domestic environment’s ability to absorb it. This involves investment in human capital, fostering stronger linkages between foreign and domestic firms, regulatory reforms that ensure transparency and trust, and above all, maintaining macroeconomic stability to reduce inflationary pressure. Trade liberalization and investment openness must go hand-in-hand with institutional strengthening to allow for more meaningful and sustained integration into the global economy. One of the key strengths of this study lies in its methodological rigor. By employing fixed-effects panel regression and including lagged explanatory variables, it accounts for both time-dependent effects and unobserved country-specific heterogeneity. This improves causal inference and helps distinguish short-term from structural impacts of FDI. The study is also anchored in a strong theoretical framework, the Absorptive-Capacity Hypothesis, allowing the analysis to go beyond descriptive statistics and offer theory-driven insights. Additionally, the research is highly policy-relevant. It provides direct, actionable guidance for governments in the South Asian region—guidance that is timely given global shifts in investment flows and supply chains in the post-COVID and geo-economic context. Despite its contributions, the study is not without limitations. First, the time period (2019–2023) is relatively short for capturing long-run effects of FDI or institutional change, and may be influenced by exogenous shocks such as the COVID-19 pandemic. Second, the use of aggregate FDI data does not distinguish between types of investment (e.g., greenfield vs. mergers and acquisitions) or sectors (e.g., manufacturing vs. services), which may have vastly different impacts on growth. Third, while fixed effects account for country-specific unobservable, direct indicators of absorptive capacity—such as measures of governance quality, infrastructure, or education—are not included in the model due to data limitations. These constraints do not undermine the validity of the findings but highlight the need for future research to include richer data and extended time frames, ideally with sectoral breakdowns and micro-level case studies.
In sum, this study makes a valuable empirical and theoretical contribution to the debate on FDI-led growth in developing countries. It challenges the simplistic notion that capital inflows are inherently beneficial, and instead shows that their impact is highly conditional on domestic capacity and context. By integrating theory, robust empirical methods, and real-world policy relevance, the research offers both a cautionary tale and a roadmap: FDI is not a guaranteed growth engine—but with the right institutions, policies, and capacities in place, it can be transformed into a powerful catalyst for sustainable development.
Abbreviations
FDI | Foreign Direct Investment |
GDP | Gross Domestic Product |
CPI | Consumer Price Index |
RE | Random Effects |
FE | Fixed Effects |
OLS | Ordinary Least Squares |
WDI | World Development Indicators |
USD | United States Dollar |
SME | Small and Medium-sized Enterprises |
R&D | Research and Development |
ICT | Information and Communication Technology |
RE model | Random Effects Model |
FE model | Fixed Effects Model |
COVID-19 | Coronavirus Disease 2019 |
PSTR | Panel Smooth Transition Regression |
Author Contributions
Atia Ahmed: Conceptualization, Data curation, Formal Analysis, Methodology, Writing – original draft, Writing – review & editing
Murshida Hossain: Conceptualization, Data curation, Writing – original draft, Writing – review & editing
Kaniz Habiba Afrin: Conceptualization, Writing – original draft, Writing – review & editing
Sunjida Parven: Writing – original draft, Writing – review & editing
Afsana Jahan: Writing – original draft, Writing – review & editing
Conflicts of Interest
The authors declare no conflicts of interest.
References
| [1] |
Ward, Patrick, Alex Hurrell, Aly Visram, Nils Riemenschneider, Luca Pellerano, Clare O’Brien, Ian MacAuslan, and Jack Willis. (2010). Cash Transfer Programme for Orphans and Vulnerable Children (CT-OVC) In Kenya: Operational and Impact Evaluation, 2007–2009. Oxford Policy Management.
|
| [2] |
Baez, Javier E., and Adriana Camacho. (2011). “Assessing the long-term effects of conditional cash transfers on human capital: evidence from Colombia,” The World Bank, Washington DC.
|
| [3] |
de Groot, R., Handa S., M. Park, R. Osei Darko, Osei-Akoto I., G. Bhalla, and L. P. Ragno. (2015). “Heterogeneous impacts of an unconditional cash transfer programme on schooling: evidence from the Ghana LEAP Programme,” UNICEF Office of Research, Florence.
|
| [4] |
Evans, David, Stephanie Hausladen, Katrina Kosec, and Natasha Reese. (2014). “Community-based conditional cash transfers in Tanzania: Results from a randomized trial,” The World Bank, Washington D. C.
|
| [5] |
Fisher, Eleanor, Ramlatu Attah, Valentina Barca, Clare O’brien, Simon Brook, Jeremy Holland, Andrew Kardan, Sara Pavanello, and Pamela Pozarny. (2017). “The Livelihood Impacts of Cash Transfers in Sub-Saharan Africa: Beneficiary Perspectives from Six Countries,” World Development, vol. 99, pp. 299-319.
|
| [6] |
Hagen-Zanker, Jessica, Luca Pellerano, Francesca Bastagli, Luke Harman, Valentina Barca, Georgina Sturge, Tanja Schmidt, and Calvin. Laing. (2017). “"The impact of cash transfers on women and girls,” Education, vol. 42, no. 15, p. 2.
|
| [7] |
Handa, Sudhanshu, and Michael Park. (2012). “Livelihood Empowerment Against Poverty Program Ghana Baseline Report,” Carolina Population Center, University of North Carolina at Chapel Hill.
|
| [8] |
Handa, Sudhanshu, Carolyn Tucker Halpern, Audrey Pettifor, and Harsha Thirumurthy. (2014). “The government of Kenya's cash transfer program reduces the risk of sexual debut among young people age 15-25,” PloS one, vol. 9, no. 1, p. e85473.
|
| [9] |
Handa, Sudhanshu, Amber Peterman, Carolyn Huang, Carolyn Halpern, Audrey Pettifor, and Harsha Thirumurthy. (2015). “Impact of the Kenya Cash Transfer for Orphans and Vulnerable Children on early pregnancy and marriage of adolescent girls,” Social Science & Medicine, vol. 141, pp. 36-45.
|
| [10] |
Heckman, J., H. Ichimura, and P. Todd. (1998). “Matching as an econometric evaluation estimator,” Review of Economic Studies, vol. 65, no. 2, p. 261–294.
|
| [11] |
Himmelweit, Susan, Cristina Santos, Almudena Sevilla, and Catherine Sofer. (2013). “Sharing of resources within the family and the economics of household decision-making,” Journal of Marriage and Family, vol. 75, no. 3, p. 625–639.
|
| [12] |
Hoddinott, John, and Emmanuel Skoufias. (2004). “"The impact of PROGRESA on food consumption.,” Economic development and cultural change, vol. 53, no. 1, pp. 37-61.
|
| [13] |
Huebler, Friedrich. (2008). “Child labour and school attendance: Evidence from MICS and DHS surveys,” in In Seminar on child labour, education and youth employment, Understanding Children’s Work Project, Madrid.
|
| [14] |
Glassman, Amanda, Denizhan Duran, Lisa Fleisher, Daniel Singer, Rachel Sturke, Gustavo Angeles, and Jodi Charles. (2013). “Impact of conditional cash transfers on maternal and newborn health,” Journal of health, population, and nutrition, vol. 31, no. 4 Suppl 2, p. S48.
|
| [15] |
Donni, Olivier, and Pierre-André Chiappori. (2011). “Nonunitary models of household behavior: a survey of the literature,” Household economic behaviors, pp. 1-40.
|
| [16] |
Kilburn, Kelly, Harsha Thirumurthy, Carolyn Tucker Halpern, Audrey Pettifor, and Sudhanshu Handa. (2016). “Effects of a large-scale unconditional cash transfer program on mental health outcomes of young people in Kenya,” Journal of Adolescent Health, vol. 58, no. 2, pp. 223-229.
|
| [17] |
Kilburn, Kelly, Sudhanshu Handa, Gustavo Angeles, Peter Mvula, and Maxton Tsoka. (2017). “Short-term impacts of an unconditional cash transfer program on child schooling: Experimental evidence from Malawi,” Economics of education review, vol. 59, pp. 63-80.
|
| [18] |
Kenya National Bureau of Statistics. (2007a). “Basic Report- Kenya Integrated Household and Budget Survey, 2005/06,” Government of Kenya, Nairobi.
|
| [19] |
Kenya National Bureau of Statistics. (2017a). “Basic Report- Kenya Integrated Household and Budget Survey, 2015/16,” Government Press, Nairobi.
|
| [20] |
Kenya National Bureau of Statistics. (2007b). Basic report on well-being in Kenya: based on Kenya integrated household budget survey, 2005/06, Nairobi: Kenya National Bureau of Statistsics.
|
| [21] |
Merttens, Fred, Michele Binci, Scott Molly, Barberis Virginia, Taylor Edward, Thome Karen, Attah Ramla, O. Sope, H. Chris, J. Emma, H. Alastair, L. Hanna and W. Johanna. (2017). “Evaluation of the Kenya Hunger Safety Net Programme Phase 2: Impact evaluation final report,” Oxford Policy Management.
|
| [22] |
Miller C. and M. Tsoka. (2012). “Cash transfers and children’s education and labour among Malawi’s poor,” Development Policy Review, vol. 30, no. 4, p. 499–522.
|
| [23] |
National, Gender and Equality Commission. (2014). “Participation of Vulnerable Populations in Their Own Programmes. The Cash Transfers in Kenya.,” Government of Kenya, Nairobi.
|
| [24] |
Otulana, S., C. Hearle, R. Attah, F. Merttens, and J. Wallin. (2016). “Evaluation of the Kenya Hunger Safety Net Programme Phase 2: Qualitative Research Study - Round 1,” Oxford Policy Management.
|
| [25] |
Owusu-Addo, Ebenezer, and Ruth Cross. (2014). “The impact of conditional cash transfers on child health in low- and middle-income countries: a systematic review,” International Journal of Public Health, vol. 59, p. 609–618.
|
| [26] |
Parker, Susan W., and Petra E. Todd. (2017). “Conditional Cash Transfers: The Case. of Progresa/Oportunidades.,” Journal of Economic Literature, vol. 55, no. 3, p. 866–915.
|
| [27] |
Pace, Noemi, Ashwini Sebastian, Silvio Daidone, Ana Paula Dela O. Campos, Ervin Prifti, and and Benjamin Davis. (2022). “Cash transfers’ role in improving livelihood diversification strategies and well-being: short-and medium-term evidence from Zimbabwe,” World Development, vol. 154, p. 105874.
|
| [28] |
Ralston, Laura, Colin Andrews, and Allan Hsiao. (2017). “The impacts of safety nets in Africa: what are we learning?,” The World Bank.
|
| [29] |
Republic of Kenya. (2007). “The Kenya Vision 2030,” Governemnt Press, Nairobi.
|
| [30] |
Republic of Kenya.(2011). “Kenya National Social Protection Policy,”. Government of Kenya, Nairobi.
|
| [31] |
Republic of Kenya. (2012). “Children Act: Chapter 141 Laws of Kenya,” National Council for Law Reporting, Nairobi.
|
| [32] |
Republic of Kenya. (2013). “Millennium Development Goals Status Report,”. Government of Kenya, Nairobi.
|
| [33] |
Republic of Kenya. (2016). “ Inua Jamii Towards a More Effective National Safety Net for Kenya. P rogress Report.,” Government of Kenya, Ministry of Labour and East African Affairs, Nairobi.
|
| [34] |
Roby, Jini L., Lance Erickson, and Chanel Nagaishi. (2016). “Education for children in sub-Saharan Africa: Predictors impacting school attendance,” Children and Youth Services Review, vol. 64, pp. 110-116.
|
| [35] |
Richterman, Aaron, Christophe Millien, Elizabeth F. Bair, Gregory Jerome, Jean Christophe Dimitri Suffrin, Jere R. Behrman, and and Harsha Thirumurthy. (2023). “The effects of cash transfers on adult and child mortality in low-and middle-income countries.,” Nature, vol. 618, no. 7965, pp. 575-582.
|
| [36] |
Rosenbaum, Paul R., and and Donald B. Rubin. (1983). “The central role of the propensity score in observational studies for causal effects,” Biometrika, vol. 70, no. 1, pp. 41-55.
|
| [37] |
Schultz, Theodore W. (1972). “Human Capital: Policy Issues and Research Opportunities,” in Economic Research: Retrospect and Prospect, vol. 6, National Bureau for Economic research.
|
| [38] |
Schultz, T. Paul. (2004). “Evidence of returns to schooling in Africa from household surveys: Monitoring and restructuring the market for education,” Journal of African Economies, vol. 13, no. no. suppl_2, pp. ii 95-ii 148.
|
| [39] |
Schultz, T. Paul. (1999). “Health and Schooling Investments in Africa,” Journal of Economic Perspectives, vol. 13, no. 3, p. 67–88.
|
| [40] |
Ranis, Gustav, Frances Stewart, and Alejandro Ramirez. (2000). “Economic growth and human development,” World development, vol. 28, no. 2, pp. 197-219.
|
| [41] |
Mankiw, Gregory, David Romer, and David Weil. (1992). “A Contribution to the Empirics of Economic Growth,” Quarterly Journal of Economics, vol. 107.
|
| [42] |
Romer, Paul. (1989). “Human Capital and Growth: Theory and Evidence,” Annals of Economics and Finance, vol. 15, no. 1, pp. 765-816.
|
| [43] |
Almendarez, Leroy. (2013). “Human capital theory: Implications for educational development in Belize and the Caribbean,” Caribbean Quarterly, vol. 59, no. 3-4, pp. 21-33.
|
| [44] |
Barro, Robert J., and Jong Wha Lee. (2013). “A New Data Set of Educational Attainment in the World, 1950–2010,” Journal of development economics, vol. 104, pp. 184-198.
|
| [45] |
Schultz, Theodore W. (1961). “Investment in Human Capital,” The American Economic Review, vol. 51, no. 1, pp. 1-17.
|
| [46] |
Sebastian, Ashwini, Ana Paula de la O Campos, Daidone, Silvio Noemi Pace, and Ousmane Niang, and Luca Pellerano Benjamin Davis. (2019). “Cash Transfers and Gender Differentials in Child Schooling and Labor: Evidence from the Lesotho Child Grants Programme." Population and Development Review, vol. 45, no. S1, pp. 181-208.
|
| [47] |
Skoufias, Emmanuel. (2005). PROGRESA and its impacts on the welfare of rural households in Mexico, vol. 139, International Food Policy Research Institute.
|
| [48] |
Sweetland, Scott R. (1996). “Human Capital Theory: Foundations of a Field of Inquiry,” Review of Educational Research, vol. 66, no. 3, pp. 341-359.
|
| [49] |
The Kenya CT-OVC Evaluation Team. (2012b) “The impact of Kenya's Cash Transfer for Orphans and Vulnerable Children on human capital,” Journal of Development Effectiveness, vol. 4, no. 1, pp. 38-49.
|
| [50] |
The Kenya CT-OVC Evaluation Team. (2012a). “The impact of the Kenya Cash Transfer Program for Orphans and Vulnerable Children on household spending,” Journal of Development Effectiveness, vol. 4, no. 1, pp. 9-37.
|
| [51] |
Thomas Duncan. (1990). “Intra-household resource allocation: An inferential approach,” Journal of human resources, pp. 635-664.
|
| [52] |
Todd, Petra E. (2007). “Evaluating social programs with endogenous program placement and selection of the treated,” Handbook of development economics, vol. 4, pp. 3847-3894.
|
| [53] |
Twerefou, Daniel Kwabena, Bernardin Senadza, and John Owusu-Afriyie. (2014). “Determinants of poverty among male-headed and female-headed households in Ghana,” Ghanaian Journal of Economics, vol. 2, pp. 77-96.
|
| [54] |
Armand, Alex, and Pedro Carneiro. (2018). “Impact Evaluation of the Conditional Cash Transfer Program for Secondary School Attendance in Macedonia,” International Initiative for Impact Evaluation (3ie).
|
| [55] |
Becker, Sascha O., and Andrea Ichino. (2002). “"Estimation of average treatment effects based on propensity scores.,” The stata journal, vol. 2, no. 4, pp. 358-377.
|
| [56] |
Behrman, Jere R., Susan W. Parker, and Petra E. Todd. (2011). “Do conditional cash transfers for schooling generate lasting benefits? A five-year followup of PROGRESA/Oportunidades,” Journal of Human Resources, vol. 46, no. 1, pp. 93-122.
|
| [57] |
Benhassine, Najy, Florencia Devoto, Esther Duflo, Pascaline Dupas, and Victor Pouliquen. (2015). “Turning a shove into a nudge? A" labeled cash transfer" for education,” American Economic Journal: Economic Policy, vol. 7, no. 3, pp. 86-125.
|
| [58] |
Browning, Martin, Pierre-Andre Chiappori, and Valerie Lechene. (2006). “Collective and unitary models: A clarification,” Review of Economics of the Household, vol. 4, no. 1, pp. 5-14.
|
| [59] |
Caliendo, Marco, and Sabine Kopeinig. (2008). “Some Practical Guidance for the Implementation of Propensity Score Matching,” Journal of economic surveys, vol. 22, no. 1, pp. 31-72.
|
| [60] |
Cruz, Marcio, and Zacharias Ziegelhofer. (2014). “Beyond the income effect: impacts of conditional cash transfer programs on private investments in human capital,” Oxford Policy Management. 2010, 2014.
|
| [61] |
Cousens, Simon, J. Hargreaves, and B. Armstrong, J. Thomas, B. R. Kirkwood, and R. Hayes. Chris Bonell. (2011). “Alternatives to randomisation in the evaluation of public-health interventions: statistical analysis and causal inference,” Journal of Epidemiology & Community Health, vol. 65, no. 7, pp. 576-581.
|
| [62] |
Chico, Ana Sanchez, Karen Macours, John A. Maluccio, and Marco Stampini. (2020). “Impacts on school entry of exposure since birth to a conditional cash transfer programme in El Salvador,” Journal of Development Effectiveness, vol. 12, no. 3, pp. 187-218.
|
| [63] |
Chikoko, Witness, Kudzai Nyabeze, Kwashirai Zvokuomba, Kudzai Mwapaura, and and Samson Mhizha. (2021). “The harmonized social cash transfer program in Zimbabwe: Achievements and challenges,” Journal of Economics and Behavioral Studies, vol. 13, no. 5, pp. 12-21.
|
| [64] |
Asfaw, Solomon, Silvio Daidone, Benjamin Davis, Josh Dewbre, Alessandro Romeo, Habiba Djebbari, Paul Winters, and Katia Covarrubias. (2012). “Analytical framework for evaluating the productive impact of cash transfer programmes on household behaviour: Methodological guidelines for the From Protection to Production (PtoP) project,” Food and Agriculture Organization of the United Nations.
|
| [65] |
Attanasio, O., E. Fitzsimons, A. Gomez, M. I. Gutierrez, C. Meghir, and A. Mesnard. (2010). “Child Education and Work Choices in the Presence of a Conditional Cash Transfer Programme in Rural Colombia,” Economic Development and Cultural Change, vol. 58, no. 2, pp. 181-210.
|
| [66] |
Asfaw, Solomon, Benjamin Davis, Josh Dewbre, Sudhanshu Handa, and Paul Winters. (2014). “Cash transfer programme, productive activities and labour supply: evidence from a randomised experiment in Kenya,” The journal of development studies, vol. 50, no. 8, pp. 1172-1196.
|
| [67] |
Basu, Kaushik. (2006). “Gender and say: A model of household behaviour with endogenously determined balance of power,” The Economic Journal, vol. 116, no. 511, pp. 558-580, 2006.
|
| [68] |
Merttens, Fred, Alex Hurrell, Marta Marzi, Ramla Attah, Maham Farhat, Andrew Kardan, and Ian MacAuslan. (2013). “Kenya Hunger Safety Net Programme Impact Evaluation Final Report, 2009 to 2012,” DFID Kenya, Nairobi.
|
| [69] |
Becker, Gary S. (1981). “Altruism in the Family and Selfishness in the Market Place.,” Economica, vol. 48, no. 189, pp. 1-15.
|
| [70] |
Becker, Gary S. (1962). Investment in Human Capital: A Theoretical Analysis. In U.-N. B. Research, Investment in Human Beings (Vol. LXX, pp. 9 - 49). The Journal of Political Economy. Retrieved from http://www.nber.org/chapters/c13571
|
| [71] |
Appleton, S. (1996). Women-headed households and household welfare: An empirical deconstruction for Uganda. World Development, Volume 24, Issue 12, 1811-1827.
|
| [72] |
Owusu-Addo, Ebenezer, Andre MN Renzaho, and Ben J. Smith. (2018) "Evaluation of cash transfer programs in sub-Saharan Africa: A methodological review." Evaluation and program planning 68: 47-56.
|
| [73] |
The Kenya National Bureau of Statistics. (2017b). Basic report on well-being in Kenya: based on Kenya integrated household budget survey, 2015/16. Nairobi: Kenya National Bureau of Statistsics.
|
| [74] |
Baser, Onur. (2007). "Choosing propensity score matching over regression adjustment for causal inference: when, why and how it makes sense." Journal of Medical Economics 10, no. 4: 379-391.
|
| [75] |
White, H., and S. Sabarwal. (2014) "Methodological briefs impact evaluation No. 8: Quasi-experimental design and methods." UNICEF Office of Research: 1-16.
|
| [76] |
Zanutto, Elaine L. (2006). "A comparison of propensity score and linear regression analysis of complex survey data." Journal of data Science 4, no. 1: 67-91.
|
| [77] |
Martens, Edwin P., Wiebe R. Pestman, Anthonius De Boer, Svetlana V. Belitser, and Olaf H. Klungel. (2008). Systematic differences in treatment effect estimates between propensity score methods and logistic regression. International journal of epidemiology 37, no. 5: 1142-1147.”
|
| [78] |
Ichwara, J. Masini, Tabitha W. Kiriti-Ng’ang’a, and Anthony Wambugu. (2024). "Impact of Cash Transfers on Child Health Status by Gender in Kenya." Ghanaian Journal of Economics 11, no. 1.
|
Cite This Article
-
APA Style
Ahmed, A., Hossain, M., Afrin, K. H., Parven, S., Jahan, A. (2025). The Conditional Promise of FDI: New Insights from South Asia’s Growth Experience. International Journal of Economics, Finance and Management Sciences, 13(4), 177-191. https://doi.org/10.11648/j.ijefm.20251304.12
 Copy
|
Copy
|
 Download
ACS Style
Ahmed, A.; Hossain, M.; Afrin, K. H.; Parven, S.; Jahan, A. The Conditional Promise of FDI: New Insights from South Asia’s Growth Experience. Int. J. Econ. Finance Manag. Sci. 2025, 13(4), 177-191. doi: 10.11648/j.ijefm.20251304.12
Copy
|
Download
AMA Style
Ahmed A, Hossain M, Afrin KH, Parven S, Jahan A. The Conditional Promise of FDI: New Insights from South Asia’s Growth Experience. Int J Econ Finance Manag Sci. 2025;13(4):177-191. doi: 10.11648/j.ijefm.20251304.12
Copy
|
Download
-
@article{10.11648/j.ijefm.20251304.12,
  author = {Atia Ahmed and Murshida Hossain and Kaniz Habiba Afrin and Sunjida Parven and Afsana Jahan},
  title = {The Conditional Promise of FDI: New Insights from South Asia’s Growth Experience
},
  journal = {International Journal of Economics, Finance and Management Sciences},
  volume = {13},
  number = {4},
  pages = {177-191},
  doi = {10.11648/j.ijefm.20251304.12},
  url = {https://doi.org/10.11648/j.ijefm.20251304.12},
  eprint = {https://article.sciencepublishinggroup.com/pdf/10.11648.j.ijefm.20251304.12},
  abstract = {This paper investigates how Foreign Direct Investment (FDI) affects economic growth in five South Asian countries—Bangladesh, India, Pakistan, Sri Lanka, and Nepal—between 2019 and 2023. Although FDI is often seen as a key driver of development through capital investment, technology transfer, and improved management practices, its actual impact on economic growth in developing countries remains unclear. This study builds on the Absorptive-Capacity Hypothesis, which suggests that the benefits of FDI depend on how well a country can use the knowledge and resources that come with it. Using macroeconomic data from the World Bank, the study applies panel data techniques and lagged variables to understand the short-run effects of FDI, while also controlling for inflation and trade openness. The analysis begins with Ordinary Least Squares (OLS) regression and continues with Fixed Effects (FE) and Random Effects (RE) models to account for differences across countries. The results show that FDI, when lagged by one year, has a statistically significant negative effect on GDP growth, while trade openness supports growth and inflation reduces it. The Hausman test confirms that the Fixed Effects model is more appropriate, highlighting the importance of country-specific factors. These findings suggest that FDI on its own may not lead to growth unless countries improve their ability to absorb and benefit from it. The paper concludes that strong trade policies, inflation control, and investment in human capital are crucial for ensuring that FDI contributes to long-term economic development in South Asia.},
 year = {2025}
}
Copy
|
Download
-
TY  - JOUR
T1  - The Conditional Promise of FDI: New Insights from South Asia’s Growth Experience

AU  - Atia Ahmed
AU  - Murshida Hossain
AU  - Kaniz Habiba Afrin
AU  - Sunjida Parven
AU  - Afsana Jahan
Y1  - 2025/07/10
PY  - 2025
N1  - https://doi.org/10.11648/j.ijefm.20251304.12
DO  - 10.11648/j.ijefm.20251304.12
T2  - International Journal of Economics, Finance and Management Sciences
JF  - International Journal of Economics, Finance and Management Sciences
JO  - International Journal of Economics, Finance and Management Sciences
SP  - 177
EP  - 191
PB  - Science Publishing Group
SN  - 2326-9561
UR  - https://doi.org/10.11648/j.ijefm.20251304.12
AB  - This paper investigates how Foreign Direct Investment (FDI) affects economic growth in five South Asian countries—Bangladesh, India, Pakistan, Sri Lanka, and Nepal—between 2019 and 2023. Although FDI is often seen as a key driver of development through capital investment, technology transfer, and improved management practices, its actual impact on economic growth in developing countries remains unclear. This study builds on the Absorptive-Capacity Hypothesis, which suggests that the benefits of FDI depend on how well a country can use the knowledge and resources that come with it. Using macroeconomic data from the World Bank, the study applies panel data techniques and lagged variables to understand the short-run effects of FDI, while also controlling for inflation and trade openness. The analysis begins with Ordinary Least Squares (OLS) regression and continues with Fixed Effects (FE) and Random Effects (RE) models to account for differences across countries. The results show that FDI, when lagged by one year, has a statistically significant negative effect on GDP growth, while trade openness supports growth and inflation reduces it. The Hausman test confirms that the Fixed Effects model is more appropriate, highlighting the importance of country-specific factors. These findings suggest that FDI on its own may not lead to growth unless countries improve their ability to absorb and benefit from it. The paper concludes that strong trade policies, inflation control, and investment in human capital are crucial for ensuring that FDI contributes to long-term economic development in South Asia.
VL  - 13
IS  - 4
ER  -
Copy
|
Download